ABSTRACT: 1582
Social class effect on quality of life. A sequential analysis
| J.G. GONZALEZ, A.M. DONALDSON, and A.N.A. DONALDSON, King's College London Dental Institute, United Kingdom | |
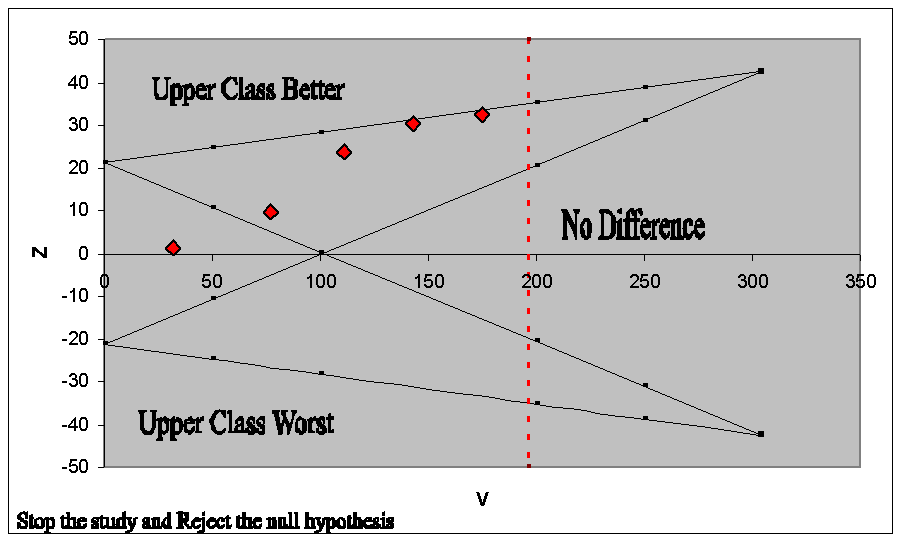
Click on images to view full size. Objective: Stopping rules allow a study to be terminated early if a conclusive result is found. This necessitates appropriate adjustments for the multiple testing. The UK Department of Health (COREC) recognises this option. Applications to observational studies in dentistry have not been explored. Adopting interim analyses on the complete database of 707 respondents of the Children Perceptions and Oral Health Quality of Life (QOL) questionnaires, we assess the effect of social class on QOL and compare the results with those based on the analysis of the overall sample. Methods: The principal outcome analysed is QOL and the main explanatory variable is a binary indicator of non-deprived class. The stopping rule adopted is the double-triangular test (Figure 1). The Z-axis measures the cumulative observed QOL-advantage for the non-deprived group. The V-axis measures (¼ of) sample size. A power requirement yields that to have 80% power to detect a difference of 3(SD=15) in QOL, 784 participants are required. Interim analyses at 20% increments of this sample size are planned. Results: All interim analyses stratify for those variable that show to be important in a multiple linear regression performed at the first inspection: gender, importance-given-to-regular-visits-to-dentist and Diet. The first three (stratified) interim analyses take place with n=127, n=308 and n=444 respectively. The sample path raises and crosses the upper boundary at the fourth inspection (n=573), indicating a significant advantage for the non-deprived group. The mean QOL difference was 2.9 (95% c.i. 0.5 to 5.6; P=0.02). An analysis with the overall sample confirms this result (mean difference=3.5; 95% ci (1.1,5.9); P=0.004). Figure 1: Sequential monitoring of the effect of social class on QOL. Conclusion: The sequential analysis reaches the same conclusion as an analysis of the overall sample with a saving of 20% in the sample size required. | |
| Seq #163 - Methodolgical Issues in Oral Health Research 10:45 AM-12:15 PM, Friday, July 4, 2008 Metro Toronto Convention Centre Room 716B | |
|
Back to the Behavioral, Epidemiologic, and Health Services Research Program | |
©Copyright 2008 American Association for Dental Research. All Rights Reserved.
